Posts mit dem Label photovoltaic werden angezeigt. Alle Posts anzeigen

Samstag, 14. April 2018

Big Picture of Energy Generation 2030

Electric Energy Generation till 2030

We can read every day about the change in the energy market. We hear about the year 2050, a time when most of our politicians are no longer with us. 
But is the Big Change to renewables so far away? 
There is only one way to understand the change, and that is, read the data we have. And I did this and present them here. The source is from BP energy statistics, you can download the data there.

Solar and Wind

I concentrate on two sources of energy solar power and wind power. Both are renewable and have the potential to power our civilization. I take the sum of both to get a more smooth picture because there is some change between wind and solar shares, that obscure the real change. The result in a logarithmic graph can show us the long-term trend:
Figure 1: (click to enlarge) red: global electric power consumption; blue: global installed solar and wind power; yellow: global mean power from solar and wind. Data source: BP

The mean global electric energy consumption is about 2000 GW, shown as the red dots, which align in the plot and show a constant growth of 3%.

All installations of wind and solar power are shown as blue dots and have an astonishing constant growth over the last 20 years in the range of 22% per year. 

The mean energy production of this fluctuating sources is much smaller as the installed capacity due to the fact, that the sun does not shine at night and the wind does not always blow. A good estimate based on data from BP shows a factor of five between the blue and yellow line. This means the wind and solar production is only 20% of the time as strong as on the nameplate. Of course, this is a statistical value and may differ between different installations.

The most interesting point is somewhere at 2030, the yellow line crosses the red line, in other words, the generated electric energy over one year from solar and wind power is larger than the electric demand in 2030!

Could this be true  

Today (end 2017), only 2% of the global electricity is from solar power, but remember only 1% was from solar power 3 years ago. In 2020 we will see 4%, 2023 we see 8%, 2026 there are 16% and 2029 32% and 2032 64%, this is the rule of exponential growth, as we all have seen in electronics. 

Figure 2: Solar energy share in different countries and the world. Source: IEA PVPS, shown in pv-magazin.

The remaining 36%, oh sorry I did not include wind power in this very short estimation!

But there is one thing, that may stop this trend. It is not the price of photovoltaics because photovoltaics is now below 3ct/kWh and thereby cheaper than any other energy source. There is a so-called learning curve that gives in the future even lower prices due to high production volumes.

The roadblock could be energy storage!

If we find no way to store the energy cheap and on the huge scale, we cannot go far beyond 50% of fluctuating renewable energy in the electric grid. And the storage demand is in the range of 24 h global electricity production, 60,000 GWh!

To imagine this number using batteries, think about the Gigafactory built by Elon Musk. If it reaches full capacity it may supply 100 GWh of batteries a year. If we install all the batteries in the grid, we need 600 years until we have enough storage. This works only out when the batteries have a lifetime of at least 600 years. 
Figure 3: Gravity Storage, a large-scale electricity storage system.

We need new ideas, my concept of a Gravity Storage may show a way out of this problem. One Gravity Storage site can store up to 8 GWh of energy, and we don't need expensive raw materials only rock and water.

But this is another story. 


Mittwoch, 20. Dezember 2017

The demand for pumped storage facilities in central Europe

The demand for pumped storage facilities in central Europe 

IIn the year 2017 I was at two pump storage plant meetings,"Pumpspeicherwerke" in Essen on July 10,2017 and on November 29/30 at the 3rd International Pump Storage Conference in Salzburg, the results are somewhat contradictory and I want to discuss them in this blog post.

(This article about pumped storage was first posted in German language and was translated with the help of deepl.com)

International distribution of pumped storage power plants.

Pumped storage in Germany

The German pumped storage facilities have a capacity of 40 gigawatt-hours and a connected load of 6 GB,  these are enormous figures but in relation to the electricity system they are rather small, the power capacity is about one-tenth of the German electricity consumption and the energy capacity could supply Germany with electricity for less than an hour (if the power capacity were sufficient).

The task of the pumped storage plants in their original function, however, was not to supply Germany with electricity overnight if the sun doesn't shine, but to manage failures of nuclear power plants or to cover peak loads during the lunchtime period, which were caused by switching on many electric cookers in earlier days.

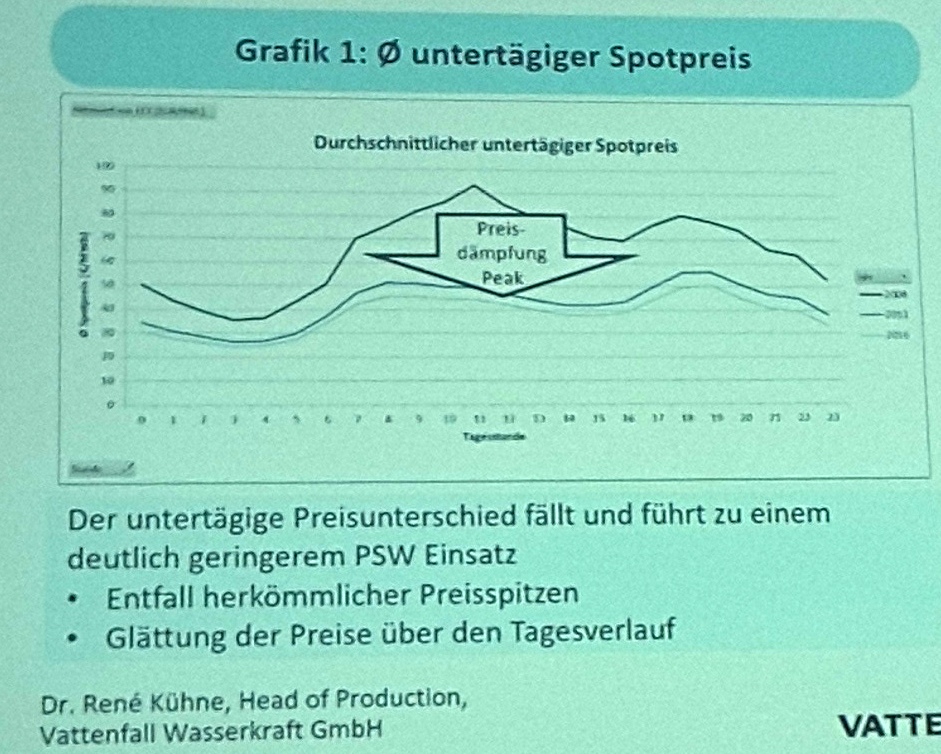
Rene Kühne on the development of the spot price, the peak at noon has disappeared. (Slides)

Today the picture has changed massively. During the day, the high number of photovoltaic systems, with around 40 GB of installed capacity in Germany, makes a significant contribution to the reduction of electricity demand peaks. Although not always, especially in the winter when it is very cloudy and only a few hundred megawatts are generated by photovoltaics. As a result, the price of electricity no longer fluctuates as much as in the past, which is precisely why pumped storage operators have a major problem financing their systems.

It is now the case that even finished plants can hardly generate the revenues to maintain operation. At the meeting in Essen, for example, some spokespersons stated that in the event of a major overhaul, such as the replacement of a turbine, the power plant would actually have to be shut down for economic reasons.

This would, of course, have considerable consequences for the electricity grid, because the pumped storage facilities are also used to stabilize the grid and are supposed to buffer solar and wind power in the future in order to provide the corresponding energy at other times of demand.

A new building is therefore practically unthinkable in Germany, which also meant that the well-known Atdorf project in the southern Black Forest was stopped, although 60 million euros have already been spent on planning.


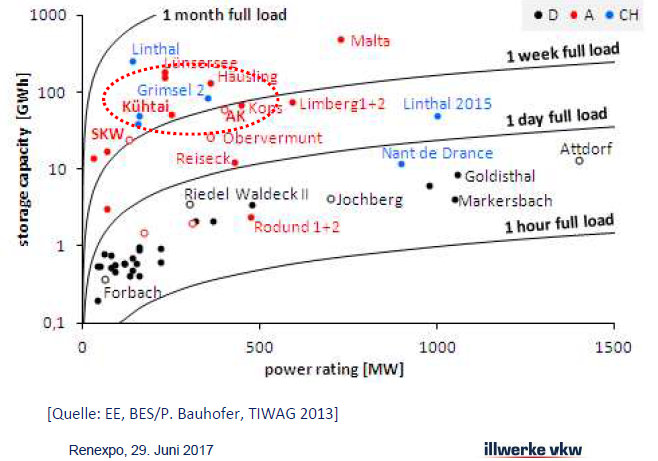
Expansion of the pumped storage power plants has almost come to a standstill, shown as yellow circles, Reinhard Fritzer, ILF (Slides)

Pumpspeicher in ÖsterreichPumped storage in Austria

The situation is different in Austria, where there are considerably more pumped storage power plants, especially in terms of storage capacity. This comes from the large slopes in the Alps around the much larger dams and thus reservoirs.

Professor Helmut Jaberg's famous plant of the Illwerke was presented at the International Pumped Storage Storage Conference in Salzburg. A pumped storage tank with a drop height of more than 800 m and over one gigawatt of power.


The ratio of stored energy to turbine power is larger in Austria and Switzerland, which means that its energy can be stored for longer periods.
Due to the large storage energy capacity, surpluses such as those from longer periods of strong wind can also be absorbed if the lines are sufficient. In times of calm, the energy can then be called off and sold at higher prices.

This is often misleadingly portrayed in the media as if Germany is giving electricity away abroad and reimporting it at great expense. No, there is a service in between that the energy is stored and delivered exactly when we need it!

Storage revenue sources

The very flat price curve for electricity cannot currently finance storage facilities, but there are other sources of revenue for storage facilities, such as balancing the grid. Energy is provided or absorbed at short notice to stabilize the grid.

Control energy is another source of revenue for pumped storage.

In the lecture of the consulting firm BET from Aachen, additional sources of income were presented.

The problem, however, is often the legal regulations, which make it very difficult to treat all markets fairly. This often shows that our energy laws are still too much dominated by the way of thinking in the old energy system. In addition, the transport of energy is not shown, all prices are valid for Germany, although there may be a surplus in Northern Germany and a shortage of electricity in Southern Germany.

The load gradients have been growing in recent years, so fast control power is required.
An alternative to storage is the expansion of the grid, but unfortunately, this is progressing very slowly, so that in the long term a lot of energy coming from wind and sun does not reach the consumer.
Network expansion, only 3% are completed in 2016, Slide Team Consult.

Conclusion

Considering pumped storage alone in a power system does not make sense. In the future, all components of a modern power grid will have to work together. Wind, offshore and onshore, PV, power lines, storage facilities in Germany but also across the border and with fair rules for everyone involved.


Dienstag, 4. April 2017

How much land area does a 100% solar powered world need?

Land demand for solar power

Solar energy for Germany, Europe, and the world

There is a picture in the solar scene (picture 1) that probably almost everyone knows, it shows how large the surface area is when the world is switched to solar energy. It was, as far as I know, published by Mrs. Nadine May for the first time in her diploma thesis at DLR [1]:

Figure 1: Space requirements for solar power plants, according to Nadine May [1]
This image is widely used and should be checked for correctness. First, Algeria is the country that contains the squares for the world and Europe, and Libya, the country which possibly receives the German solar power plants, are no more colonies.

The squares have an edge length of: world 254 km, Europe 110 km and Germany only 45 km.

How big is the energy consumption in the world?

The energy consumption of the world is constantly growing (see figure 2), so it is difficult to specify the energy requirement without a reference year. Currently, the demand is over 30,000 TWh (30,000,000,000,000,000 kWh) using the further processed data from the International Energy Agency (IEA). I have considered transforming factors for certain energy forms (transportation, heating) into electricity.

Figure 2: Global energy demand for electricity, transport and all other forms of demand

This energy should be converted with solar cells (PV) into electricity. There are several factors to consider, the efficiency, the irradiation during a year and the necessary storage of the energy for the night.

Solar cells made of silicon achieve an efficiency of around 20% and are currently the most economical method to generate large amounts of solar energy.

The irradiation is very different in different regions of the earth, in particular, one must always distinguish between direct and global irradiation. For photovoltaics (PV) only the global irradiation plays a role. Therefore, only this radiation is considered.

Figure 3: Global radiation perpendicular to the ground (source: WEC [2])
The map shows that many areas have an annual irradiation capacity of 2000 kWh per year, in particular, the Sahara, but also on other continents good locations can be found; the only exception is Europe.

Necessary Land Area

The necessary areas of the solar cells can now be easily calculated. For the world, we need 30,000,000,000,000,000 kWh per year, since one square meter has an incidence of 2000 kWh which would theoretically be 15,000,000,000 m² or 15,000 km².
Now the efficiency comes into play since only 20% is converted into electricity, we need the fivefold area, that is 75,000 km². However, one has to be able to build the cells and needs paths and additional areas for inverters and storage, which should double the space requirement. This is 150,000 km².
The transport and storage of energy, which is absolutely necessary, since at night the sun doesn't shine, will consume another 25% of the energy, so we are at 200,000 km².

This corresponds to a square of 448 km of edge length, roughly twice as large as in the drawing.

Fair World

Currently, only a few people consume a lot of energy and lots of people have little energy. I am convinced that in the long term all people want at least to reach the standard of living as in Germany. For this, an energy quantity of 15,000 kWh per year and per person would be necessary. There are some countries that already have a much higher energy requirement, but we hope that energy efficiency will also save some energy.

With a world population of 8 billion people, this will yield an annual energy demand of 120,000 TWh or 120,000,000,000,000,000 kWh, or four times the current demand. This would increase the area with solar cells to a square with an edge length of 1000 km (Fig. 4).

Figure 4: Supply the world completely with solar energy in the future
Furthermore, the area of one million square kilometers is still small compared to the Sahara, but a serious part of the solid surface of the earth. The world has about 15 million square kilometers of sunny deserts, which means about 1/15 of this area must be used in the future for solar cells to deliver enough energy.

Storage requirements

If it is assumed that the energy must be stored for at least one day, this requires a storage capacity of 330 TWh (330,000 GWh)
Compared: Germany has pumped storage with a capacity of 0.04 TWh.
If large Gravity Storage systems with 80 GWh capacity (500 m diameter) solves the problem, a considerable number of 4000 pieces would have to be built.

Using batteries from Elon Musk's Gigafactory, the Gigafactory produces at a planned capacity 50 GWh per year; over 6000 years of production or 400 Gigafactories for 15 years are required. This is to provide the capacity for the first time, and we have to continue production because batteries must be replaced after 15 years.

Gigantic conversion

If the global conversion to solar energy succeeds, huge buildings in the form of gigantic solar fields will be necessary. Surely the roof surfaces are never enough. Furthermore, investments are in the order of magnitude of the global gross social product of one year ($80,000 billion). This sounds a lot, but it will help mankind to be sustainable. Especially when one considers that afterward energy is produced clean, without CO2 and at a low cost.

I think: we can do it!


Sources:

[1] Eco-balance of a Solar ElectricityTransmission from North Africa to Europe, Diploma Thesis of Nadine May, Braunschweig, May 2005

[2] World Energy Resources Solar 2016, World Energy Council 2017

A 186 page paper going into details is from Jakobson et.al., 100% Clean and Renewable Wind, Water, and Sunlight (WWS) AllSector Energy Roadmaps for 139 Countries of the World

Samstag, 16. Mai 2015

Is 100% Photovoltaic possible?

The World powered by the Sun

Today, photovoltaic electricity is only a small fraction of the global electricity production. The volume seems to be one percent in the year 2015. If we do a very simple extrapolation and imagine, that all these PV modules were installed in 2014 and we continue this installation speed, then we need another 99 years, to have a 100% emission free PV world. But this is simply not the way the world goes round.
I will try to extrapolate the situation, based on data from the MIT report "The Future of Solar Energy" [1]

Analyse the past of Photovoltaic

If we wont to understand the future, it is very useful, to look into the past, not only to understand the development but also to understand the error which occurred by predicting the future. 
The Energy Information Administration (EIA) and the International Energy Agency (IEA) predict since 10 years the global PV installations in a published outlook. The first outlook from 2006 predicted for the year 2030 a global installation of 100 GW. This volume was already matched in the year 2011, only five years after the report was published! Ok, one wrong shot can be excused.
In the year 2011, the EIA predicted 150 GW until 2020. Again a failure, already in 2014 we have reached 180 GW of solar. 
The MIT analyzed all predictions and compiled them to a very nice picture:
Figure 1: Different predictions and the reality, source MIT [1] page 137
In the early time, the predictions of the IEA had an exponential growth, that is a good guess, because most of the time, new products grow in that type. The only problem was at that time, the growth factor was too small, for example, see IEA 2008 prediction in figure 1. Today things have gone worse with the prediction from the IEA. Not only is the factor to small, the prediction includes a reduction of the production of PV itself. This seems hard to understand. (An in-depth analysis was done by Christian Breyer, paper PDF)
Things got even more strange when we look at the price predictions of PV. The EIA predicted the development of the PV price till the year 2030. It should be mentioned, that it is a very difficult task to predict a price of any product for more than 20 years. But this failure is very illuminating.
Figure 2: Price prediction by EIA IEO 2009 of PV and observed results. [1] page 137
The EIA IEO 2009 outlook predicted, that the capital cost of PV in the year 2030 will drop to 4$/W.
Actually, the price even for residential systems dropped to this value already in the year 2014. It should be noted, that the price for residential PV systems in Germany was at the same time at 2$/W.
The price for utility PV systems reached only two years after the report was published the predicted value for 2030, 4$/W. 
All this information should be available to the EIA today. It irritates me, why the EIA does not change the prediction about the deployment of PV although they can observe the rapid price drop obviously. (I am thankful for any helpful hint)

Is there enough material for a large rollout of PV 

One possible reason, to be pessimistic about the global rollout of PV might be the scare elements used in PV systems. Today almost all PV systems use Silicon to convert sunlight into electricity. The MIT analyzed the production of different raw materials, essential for the production of SI-PV-modules. 
To set up a PV system we need concrete and steel to mount the panel in the direction of the sun. Glass, aluminum and plastic are necessary to protect the silicon cell, copper and more plastic are necessary to transport the power away.
Figure 3: Commodity materials required for PV. [1] page 131
Today, all these commodities are produced in a volume, that no real bottleneck will occur. In figure 3, we can see, that the steel production of 9 days is sufficient, to mount all PV panels for 5% of the global electricity production, within half a year, the steel production is sufficient for a 100% conversion to PV.
The least available material in this consideration is glass. For a 100% PV world, we need the glass production of 20 years. But glass production is in no way a limiting factor. The necessary raw material is sand, an endless resource.
The solar cell itself consists of a silicon wafer and some silver, are they rare?
Figure 4: The annual production and requirement for a solar future. [1] page 135
In figure 4 we see, that silver might get a little problem because we need an amount of silver that is produced within 30 years. It should be mentioned that new technologies of production can reduce the necessary mass of silver very strong. Other elements, like Ga, are only necessary if we would use GsAs cells in our PV systems what is not widely the case. 
We conclude the raw material is no show stopper for a PV future.

My prediction of PV growth

Compiling all this information, I come to a quite different prediction than the IEA. My simple, but till today best guess is, that the exponential growth will continue, but at a lower rate. 
Figure 5: Long-term trend of PV installation.
In figure 5 we see the global installation of PV shown as a black curve in this logarithmic plot. In the year 1992, we had only 100 MW of PV installed, ten years later, in 2002 it was 1000 MW, Today it is about 200 000 MW!
Update to Figure 5 including the growing power demand, wind, and the latest figures available 2016.
If the growth rate continues at 25%, as seen within the last three years, we will reach 100% PV not long after the year 2030. Remember, today we have a global power plant pool of 5300 000 MW, sufficient to power half the world. Even if we expect, that the future is fair to all people, we need "only" 10 000 000 MW to bring electricity in every home on this planet, long before 2050.  

One problem remains: Storage

Without an affordable storage system, PV can only bring electricity during sunny daytime. For a complete conversion, we need about 90 000 GWh of storage [2].
One solution for residential systems may be the power wall from Tesla, but I am not convinced, that this makes sense on a large scale. For large scale, I recommend the Gravity Storage!

References:

[1] The Future of Solar Energy, 2015 Massachusetts Institute of Technology, ISBN (978-0-928008-9-8)
[2] Elon Musk predicts (minute 18) during the presentation of the power wall 90 000 GWh of required storage. https://youtu.be/yKORsrlN-2k

Samstag, 28. Februar 2015

PV Price in the Future

Massive Price Drop in PV Systems

The future will be solar if the price of photostatic (PV) systems drops. There is a new research result about the future of the PV price online, done by Fraunhofer ISE [1], that gives surprising insights. I will discuss the results in this blog post.

Learning from experience

The first silicon PV cell date back to 1950s and since the 1980s there is a global market and production worth mentioning. Since then, the price of PV cells was constantly dropping. The interesting thing is, there is a mathematical law, that describes this drop. To keep it short, this law tells us, that every time, the production of PV doubled, the price fell about 20%. 

The actual development is shown in the graphic:

Development of PV module price since 1980 [1]

To understand this plot, be aware, the right axis is the accumulated produced capacity of PW measured in GW. It starts with 0.001 GW (=1 MW) and ends with 100.000 GW. To cover this vast range, the scale is logarithmic. The first price tag dates back to 1980, where we had to pay more than €20 per watt. The price is adjusted for inflation to the level of 2014, an exchange rate of one Euro gives $1.25 is in use. The last price tag is for 2014 and is in the range of €0.5 to €0.7 for large-scale PV power plants. 

Learning Curve

It is not surprising, that the actual price in different years is not always precise on the long-term trend curve, that shows a drop of 20,9% per year, due to market effects. 

The big question is, how will this learning curve develop in the future? There are three scenarios, a very conservative one, that tells us, only 19% drop with another doubling of the installed PV base, a medium scenario with 20.9% drop and a progressive one with 23%. However, the result will always be a sharp drop of the PV panel price, if the installed base grows in the future. 

Below a price of €0.2/W, there seems to be another limitation of the pure raw material cost. To me´, this limitation seems a little artificial, because of the price of this raw materials, like silicon or glass, could also drop if the production volume grows far beyond today's volume. 

It should be mentioned, that a capacity of 100.000 GW PV installation is equivalent to a surface of one million square kilometers, this is the size of a country like Egypt or Texas and California combined!

How expensive is electricity in the future?

The price of a PV panel is not the only part of the cost drivers in solar power. To break the price down to a kWh of electricity at the grid feed in, we have to include other cost drivers. 

Price of different elements for real-world PV grid-scale sites. [1]

The first surprising thing is, that the PV-modules are no longer the main cost driver, as shown in the figure above. The cost of mounting, connecting and planning top already this cost. The paper from ISE does not cover "Red tape", this will hopefully drop in the future, but nobody knows.

Another significant part of the cost drivers are the inverter, they produce AC from the DC, generated by the PV cell. The price of this inverter follows a similar law of price drop by market volume as the PV panels.

Price per kWh

To calculate the price of a kWh of electricity itself, we have to take the solar radiation and the capital cost into account. There is a calculation method, the levelized cost of electricity (LCOE). It includes capital cost and maintenance of the PV power site. If you are a geek, you can do the math with the following formula:

Calculation of the levelized cost of electricity (LCOE). [1]

The interesting result is, that one of the main factors for electricity from PV is not only the sun but the interest or discount rate. Today, we live in a world with very different interest rates. A strange effect is, if we look at the globe, the countries with high insulation have often very high-interest rates. For example, Germany has a low insulation but also a low-interest rate, Spain has a relative high insulation but a significantly higher interest rate. The result is, the price of PV energy is much more similar as we first guess.


PV power price depends on the cost of capital. [1]

Long-term development

To look into the future beyond 2020 is very difficult, but the gathered information gives us some hints. The first thing is, PV electricity price will drop due to the learning effect resulting from the growing market. The market is growing because PV electricity gets cheaper and is competitive with all other electric power sources. The long-term price in the scenario of ISE is in the range of  2 ct/kWh. 
The share of the market will be beyond 30% in 2050. 

But there is an obstacle on the path to solar. The sun shines only at daytime and only if there are no clouds. This results in a strong request for energy storage. One solution is the new concept of Hydraulic Rock Storage (HRS) as developed by the Heindl Energy in Germany. 

Energy storage using the Hydraulic Rock Storage. [2]

Combining a cheap storage with a storage price of 3 ct/kWh and PV in the range of 2 ct/kWh gives a long-term price for electricity over the whole day, only a fraction is stored, for less than 5 ct/kWh in most regions of the world.

Reference:


[1] Fraunhofer ISE (2015): Current and Future Cost of Photovoltaics. Long-term Scenarios for Market Development, System Prices and LCOE of Utility-Scale PV Systems. Study on behalf of Agora Energiewende. http://www.agora-energiewende.org/service/publications/
[2] Heindl Energy, Hydraulic Rock Storage, http://heindl-energy.com/ 

Freitag, 20. Juli 2012

Is German Special?

Germany is the country with the largest relative (4%) and absolute (27 GW) share of solar energy in the grid. The reason is not the nice sunny weather in Germany, the reason is a strong subsidies policy called EEG (Renewable Energy Law). It gives the producer of photovoltaic (PV) electricity a good, fixed price over 20 years. Did this really have an impact on the growth of photovoltaic installations?
German was leading the growth rate, now the world has changed!
At the end of the 90s, the growth of PV installations grows with a rate of about 30%. This is quite a lot. With the start of the EEG in 2000, the growth rate in Germany leap jumped to more than 100%. At the same time, the rest of the world has ever seen a decrease in the growth rate, down to 20%. During the last two years, things have changed again. The World, without Germany, has now 2011 a growth rate of 80% in PV installations, while Germany has fallen back to 40%, half of the global speed.

Why this Change?

The reason for this change lays in the price of PV-systems. During the last decade, the price declined from somewhere above 5000 $/kW down to 1000 $/kW due to the strong market in Germany. This low price makes PV economical within most of the sunny countries like Italy or India. Most countries have about double the sun radiation during the year than Germany receives.  
It seems so, that the growth of the solar installations is now market driven and therefore sustainable. But be aware, what 80% growth means, within 11 years, if the trend continues, the world may have changed to a complete solar energy driven world. Today, only 0,4% of the electricity is from solar, but in 2023 it could be near to 100%!


Donnerstag, 12. Juli 2012

Global Growth of Growth of PV

The global volume of installed photovoltaic installation is growing fast, this is a well-known fact. But not so widely known is the exact growth rate so I will give some figures for a deep insight.
Different countries are different, so have a look at different countries.
An incredible dynamic in the growth of PV-installations
Fifteen years ago, the USA was the leader in PV-installations. In the year 1996, Japan became the leader but in 2005 another change at the top happened, Germany, supporting PV with high subsidies, took the lead. But the PV-market has a very high dynamic and in 2011 Italy installed already more PV-panels than Germany. This race is interesting, but not the core of the global change in the PV market. Let's have a look at the growth rate itself:
The growth rate is growing at 3% per year!
If we plot the growth rate between two years, we find an astonishing plot. Beginning in the mid ninety's, the growth rate was about 20% per year. And sometimes I have the feeling, many people have adapted this and believe in a moderate growth of PV. The last 15 year show a very different picture. The growth rate itself was growing. And a simple linear approximation results in a slope of 2.9 percent points (absolute!) per year, resulting in an approximated growth of the PV installation 2011 compared to 2010 of 67% (the actual value was even higher with 76%)

Reasons for the PV Growth

This mind-blowing effect is not widely anticipated. The reason for this effect is no longer the high subsidies of German PV-installation, the reason is, more and more countries start installing PV at a very high rate, as the first graph shows. And the reason behind this is, that many countries have much more sun as Germany combined with the hard drop of PV-prices. This results in an unprecedented dynamic, higher market volume result in higher production rate, higher production volume results in lower prices due to a learning curve.
The learning curve tells us, if we double the production, the price will fall about 20%. The dropping price opens more markets, if the price is below the power price at the consumer, he will install PV soon. 
Where will this growth end, this is not clear, but I will write about that topic soon.

Dienstag, 10. Juli 2012

The Energy Age

Within human history, we have seen four times, where the primary energy source changed.
The first and most significant moment in energy history was the control of fire. It gave us something, no animal ever had, heat and light, independent of the environment. But as burning wood was the widespread source of energy, it got rare and too expensive for burning anywhere.
The second change was the move to coal, including the development of the steam power engines. It gave us independence from the location for mechanical work. Before the steam power age, at some places, water power had some impact on production. Burning coal is cheap, but coal is finite and the carbon dioxide emission seems to be a serious threat to the climate.
The third change was oil. Combined with the ford car, it gave us mobility on land, and a bit later, in the air. The 20th century was the golden age of stored energy in mineral oil. After peak oil at the beginning of the 21st century, it is not a good idea, to rely on this energy source forever.
The fourth change never made it to the top level, it is the nuclear power, a very strong power source, but also a very dangerous fire. It started with the atom bomb and was controlled to some level in nuclear power plants.  Due to human frailties resulting in design and operation errors of facilities, some power plants failed disastrously.
With the upcoming of the silicon age for semiconductors, a small niche appeared for the use of silicon. Solar cells on satellites for energy supply. Invisible small amounts of energy were generated in the 70´s, first attempts for commercial use started in the 80´s, continuous growth began in the 90´s and as a trend, every 18 months since then, the global photovoltaic installation doubled. This is called an exponential growth. You see just nothing at the beginning, and after some time astonishing things happen.
This fifth energy source is different to the accustomed energy sources we have seen in history, it does not contain an inherent storage system, so we have to care about energy storage!
Concluding this, my thesis is:
  1. Within the next 20 years, photovoltaic will be the primary energy source of the globe
  2. Energy storage will be the most critical point of this change
Keeping this in mind, my blog will tell you the story of this fascinating change in human energy generation. You have the chance, to watch live the biggest and last change in energy supply of mankind!